Carbon Nanoparticle Analysis
This portfolio presents my work from spring 2023 on the analysis of carbon nanoparticles. These materials are a subject of significant research due to their wide-ranging applications in fields like drug delivery, bioimaging, and energy storage. My project focused on addressing a key challenge in this research: the manual, time-consuming nature of analyzing microscopy images of these materials.
The Project: Automation through Computer Vision
The core of my work involved developing an automated image processing workflow to characterize carbon nanoparticles. I used a methodology inspired by a study from Meng et al., which combined a Hough Transform-based circle detection with Canny Edge detection. This approach allowed for the determination of the average size of fused particles within an image.
My contribution to this methodology was its successful application to images with a significantly higher degree of particle overlap, a common and difficult problem in material science. This project demonstrates the practical application of computer vision and algorithmic analysis to streamline data characterization in material science research.
Methods: A Recipe for Sizing a Raspberry Drupelet
Imagine you’re trying to figure out the average size of the tiny druplets that make up a raspberry. You can’t just measure them all by hand; that would take forever! My project tackled a similar problem, but with microscopic carbon nanoparticles instead of raspberry drupelets. Here’s the recipe I developed to get the job done automatically.
Step 1: Grayscale Conversion and Edge Detection
First, the raw image is converted to a grayscale image. This removes unneeded information, and allows for better compression. Next, to find the edges of the particles, I applied an edge detection filter. After testing a few different methods, I found that the Canny Edge detector worked best. It uses a clever technique called hysteresis thresholding that’s especially good at finding the “soft edges” of these particles, filtering out noisy details while keeping the important ones.
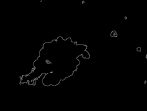

Different edge maps for the same image produced by Canny Edge. The image on the right, which was optimized to omit complicated boundaries, was the one used for further analysis.
Step 2: Finding Circles with the Hough Transform
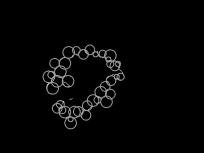
Now that we have a clean outline, we need to find the circles. The Hough Transform is a powerful tool for this, as it’s designed to find shapes like circles and lines in an image. It’s like a voting system for pixels: each point on an edge “votes” for all the possible circles it could be a part of. The circles that get the most votes are the ones we detect.
Step 3: Filtering with a Custom Mesh Method
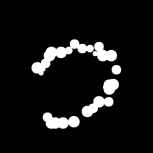
The Hough Transform sometimes finds circles that aren’t quite right—like an inner and outer circle for the same particle. To solve this, I created a custom filtering method. I treated the original grayscale image as a mesh and evaluated each detected circle. If a circle didn’t cover enough of the dark pixels (the particles themselves), it was thrown out. This step helped us keep only the circles that accurately represented the nanoparticles.
Step 4: The Final Measurement
Once the correct circles were isolated, I averaged their radii to determine the mean particle size. This final, quantitative measurement provides a clear, reproducible, and automated alternative to the traditional, time-consuming method of measuring particles by hand.